Big Data Visualization: What it is, techniques, software

Many people claim that seeing an image of some information makes it much easier for them to understand it. These visual learners make up to 65% of all the population, so being able to present data in a graphical format is important to reach out to a larger audience. Combine this with other methods and it will be guaranteed that you will reach out to everyone you need. However, what really is the visualization of big data? Read on to find out.
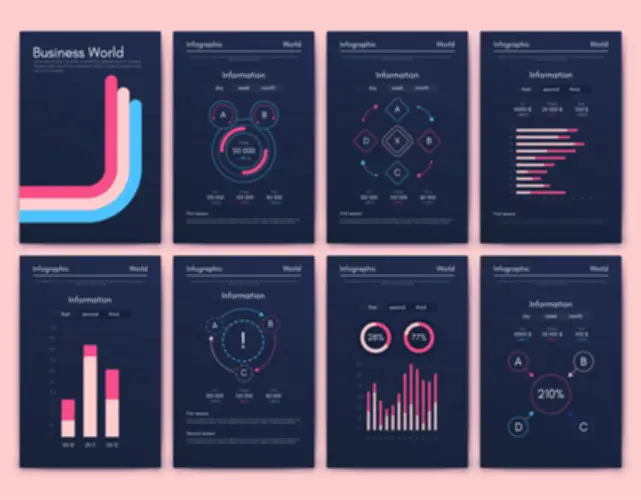
What is Big Data Visualization?
In a nutshell, big data visualization is a way of presenting different kinds of information in a graphical format. This can be a pie chart, chart, map, several bullet points, and many other variations. This is what every average person would think. However, it is a bit more complex than that.
Big data visualization is not only about making the understanding of various information more simple. One of its major tasks is to make the process faster and more efficient. Different presentations of the same bit of information may change the way you think of something drastically.

We are confident that we have what it takes to help you get your platform from the idea throughout design and development phases, all the way to successful deployment in a production environment!
Why is it so important?
The amount of content created grows each year. People have no time to get engaged with each bit of information, so it is necessary that the most valuable parts are extracted and presented in a different way.
This is not only a way to visualize the data properly, but it is also a method that provides an improved way to:
- Analyze huge amounts of data in the shortest time frames
- Spot trends without much effort
- Notice correlations between different information
- Present data to a wide audience.
All these points are part of the data visualization map and none of them may be neglected if you want to become an expert on the topic.
Data visualization processes and tricks
People are capable of recognizing multiple visual patterns in order to speed up the processing of different information. This makes it possible for specialists to use this feature in order to simplify the visualization of various data.
There are some techniques that must be mentioned. They will be listed below.
1. Linear visualization
In this feature, everything that relates to lists is included. This can be a bullet point list or sorting of different items by some criteria. This makes it easy to point out some short theses without having to spend time on analyzing pages of information.
2. Maps
In visualization, maps are often used to represent voting results, the impact of something on a location, and other similar details. This makes it easier to acquire the data because you can see the info and read it at the same time.
3. 3D models and simulations
This point is applicable to many fields. An example might be a chemical reaction. For most students, it is hard to imagine how things work without seeing them. However, a simulation and a 3D model of that can do the trick in simplifying their studies.
4. Temporal visualization
This feature includes everything that is related to timelines, time charts, and others. Basically, this is the representation of the development of some processes throughout a specified period of time.
5. Multidimensional visualization
This point is a combination of several others. People are different, so everyone needs an individual approach. The multidimensional approach assists in testing various techniques in order to engage a larger audience. Pie charts, treemaps, spider charts, and others are included.
6. Treemaps
This technique is used to show a certain hierarchy in something. It includes many different visualizations like dendrograms and different types of tree charts.
Do you need data visualization?
In most cases, the answer would definitely be “Yes!”. The reason is that big data involves gigantic amounts of information that cannot be perceived by any normal means. That is why it is so important to be able to visualize it properly so that even a person who is unaware of the topic would understand it.
However, it is not necessary to have huge amounts of data in order to benefit from proper data visualization. Almost anything can be improved by using proper techniques. There always is space for increasing the efficiency of anything.
Data visualization problems
Although big data visualization may seem to be something simple to learn, there actually are many pitfalls in it. Some of them are:
- The lack of specialists in visualization
To get the maximum from any software, it is necessary that an expert uses it. Of course, there are no restrictions on the usage of the software because it is made in such a way to be available to everyone, but only a specialist will be able to get the most out of it.
- Hardware restrictions
If you think about it, big data visualization is primarily a computing task. This means that powerful hardware is required in order to complete this task quickly. It also might be necessary to use fast storage or even go for cloud computing.
- Data quality
Inaccurate data is not an option when working in this area. A small mistake may make the whole idea fail. That is why there must be specialists who are responsible for sorting the data and gathering only relevant up-to-date information.
What tools are used for Big Data visualization?
On the internet, it is possible to find plenty of tools that may be used to visualize any kind of information. However, you should only use the best software, and this includes:
- Google Charts
- Tableau
- Grafana
- js
- FusionCharts
- Datawrapper
- Infogram
- ChartBlocks and others.
If these are too difficult for you, the simplest services that can be used are amCharts or Canva. There are multiple templates for charts and graphs, just enter your information and numbers and see it work!
The bottom line
Big Data visualization is very important no matter what field you work in. Even if there is not a lot of information, it is better for you to use at least some of the techniques that were mentioned in this article to simplify the perception of information by your team members.
Some of the best services for data visualization have been mentioned too. These include online and on-premise software with different features, so you can choose anything that suits you. Visualize and enhance your data!
Top Articles
ABC of DevOps Testing: Types, Best Practices, and Everything You Need to Know
I am here to help you!
Explore the possibility to hire a dedicated R&D team that helps your company to scale product development.


